
June 2021 Newsletter – The Fear of a Crash
“Far more money has been lost by investors trying to anticipate corrections, than lost in the corrections themselves.”
Peter Lynch
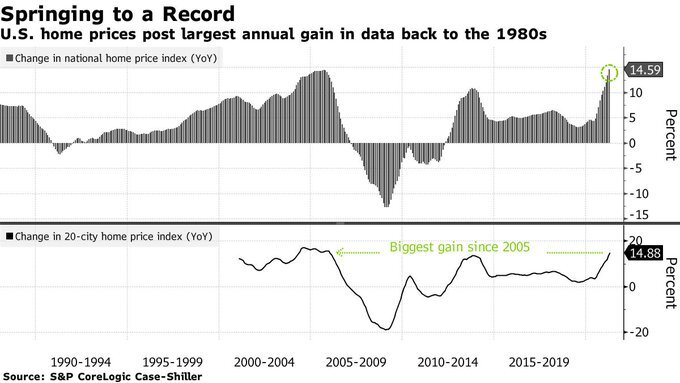
The biggest question most people seem to have about markets today is not if a correction is going to happen but when. The list of reasons seems to keep growing. The US housing market for instance is posting the largest annual gains since 1980.
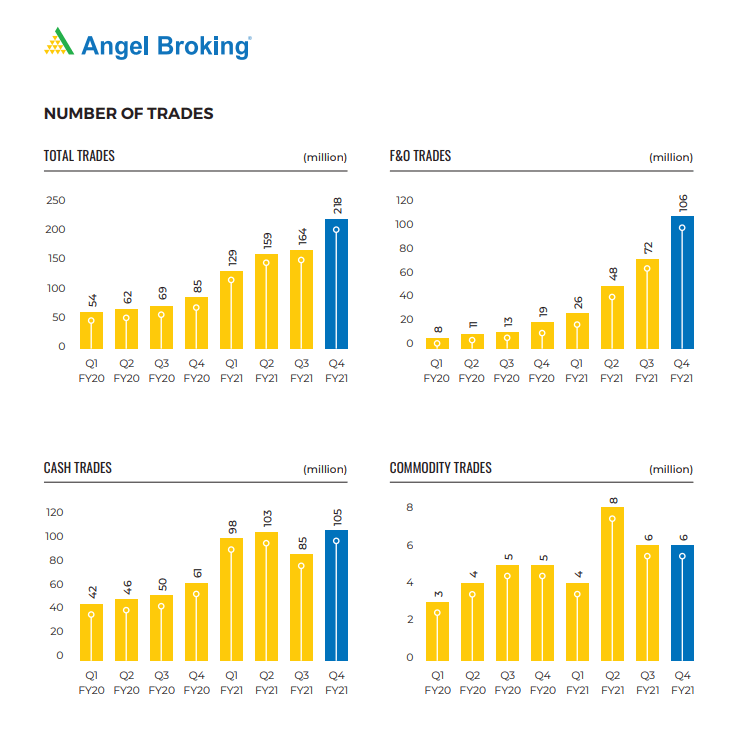
Both in India and the United States, Retail Investors are jumping into the action like never before. Millions of new accounts are giving a boost to the bottom lines of brokers. Look at the spike in trading numbers at Angel Broking, a discount broker.
While investors who have seen multiple cycles are exercising caution, the plethora of new investors whose only historical understanding is – Buying on Dip is the easiest way to make money is in the frontline of activity.
One of the biggest winners in the last year has been Saregama. Saregama has moved from 180 which was the low of March to 3480. Incidentally Saregama was a big winner in the Dot Com boom too, moving from a low of 12 in March 1998 to a high of 2310 in March 2000. Sometimes history doesn’t just rhyme but actually repeats.
Some disconcerting charts from the US Markets
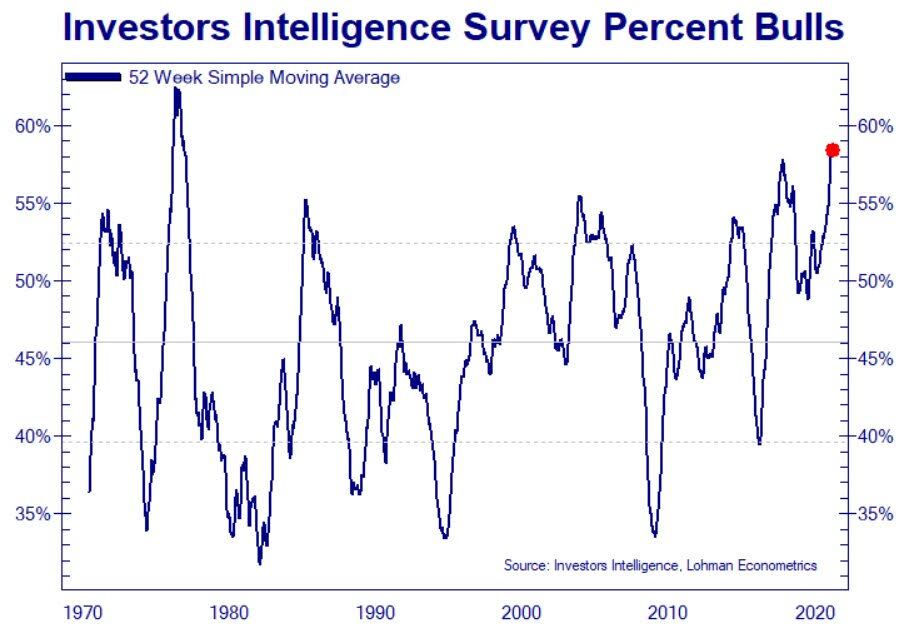
I am not a great believer in surveys and yet this showcases how one sided market participants may have become in this rally.
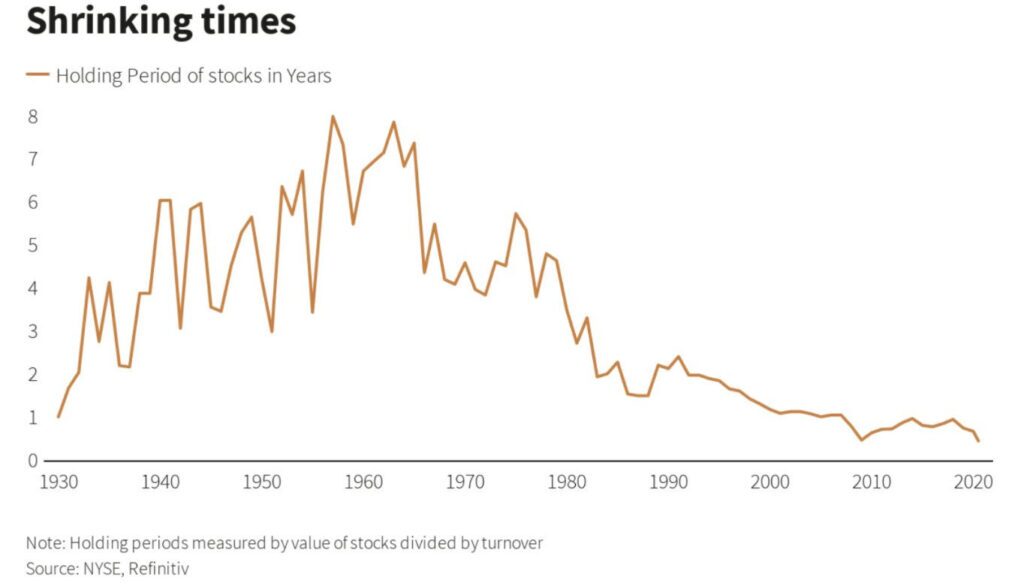
Previous chart seems to go perfectly well with this chart. Buy Right and Sit Tight – who does that anyways.
Since April 2020, Nifty Small Cap 250 Index has seen a negative month just twice and even there, it was not greater than 2%. The index itself has risen 210%. This is a phenomenal return that we have not seen in the Index in such a short span of time.
Year to date on the National Stock Exchange, we have had 199 stocks that are below where they were at the beginning of the year and 1441 stocks that have gained. The average gain being 61% vs average loss of 14%.
When markets move too much too fast, it only brings bad memories to those who have seen a bear market or two. Is this the end one starts to question. This more so when one sees stocks that have been dead being rescued more by narratives than numbers.
Near the peak of the dot com bubble, we had an Initial Public Offer by a company called (I hope memory serves me right here) Computer Shoppee. The company was a new one and hoped to set up computer shops throughout the country. What was interesting about the issue was that the issue was at a face value of Rupee One. I don’t even remember if it was listed since the bubble burst soon after.
The Public Offer of Reliance Power which has become folklore. Cut to today and we will shortly see public issues by companies that have over time lost tons of money and even today have no clue about when it will eventually turn profitable.
One way to look at if markets are closer to a peak is to look at the percentage of stocks that have generated high returns in the last 3 to 5 years. The thought process here is that at peaks, most stocks would have gained tremendously. This is also a reason for the public to get attracted because it shows them that making money in markets is fairly easy.
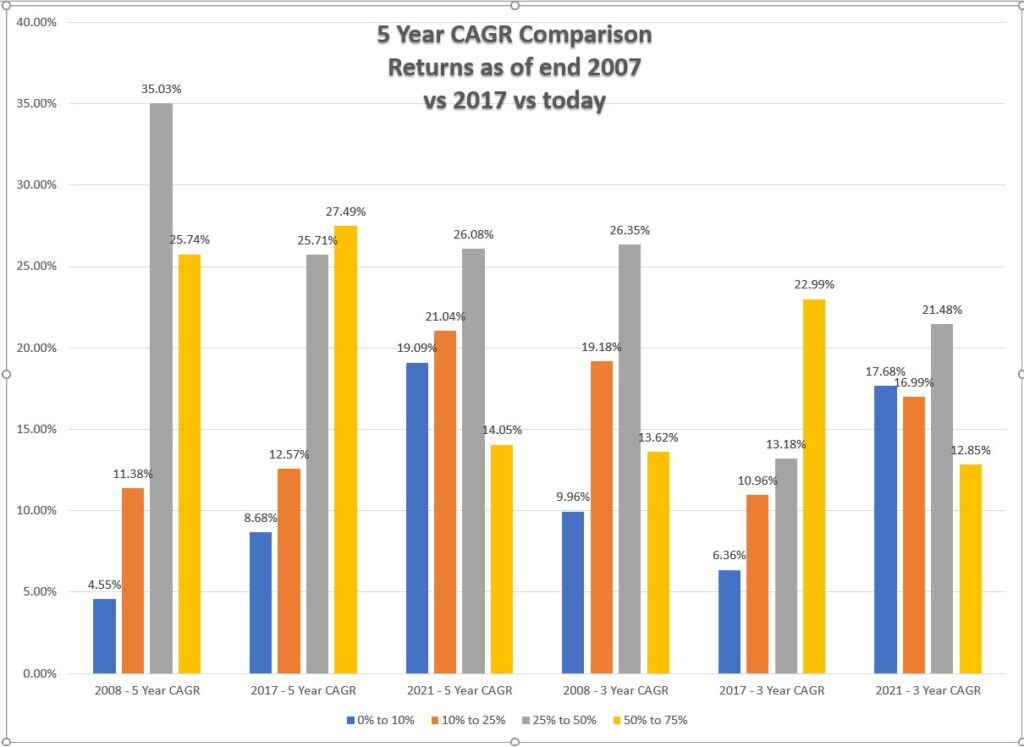
The above graph denotes the percentage of stocks (Y Axis) that had the gains in the bracket. So, for example at the peak of 2008, 35% of stocks listed on the National Stock Exchange had 5 Year CAGR returns between 25% to 50%. Today this number stands at 26%, similar to what we saw at the end of 2017.
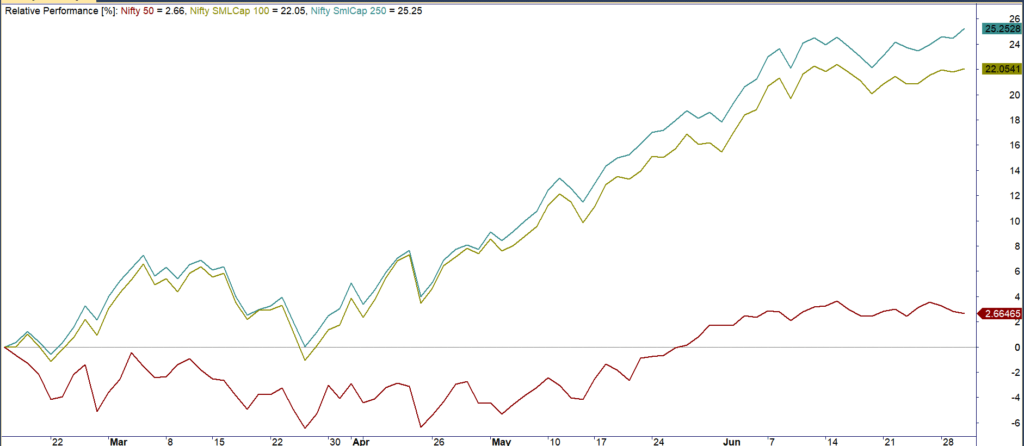
Since February of this year, we are seeing divergence in performance between the Large cap Index and the Small Cap Indices, This again foretells of a high probability of reversal on the cards though how long a divergence can remain is anyone’s guess.
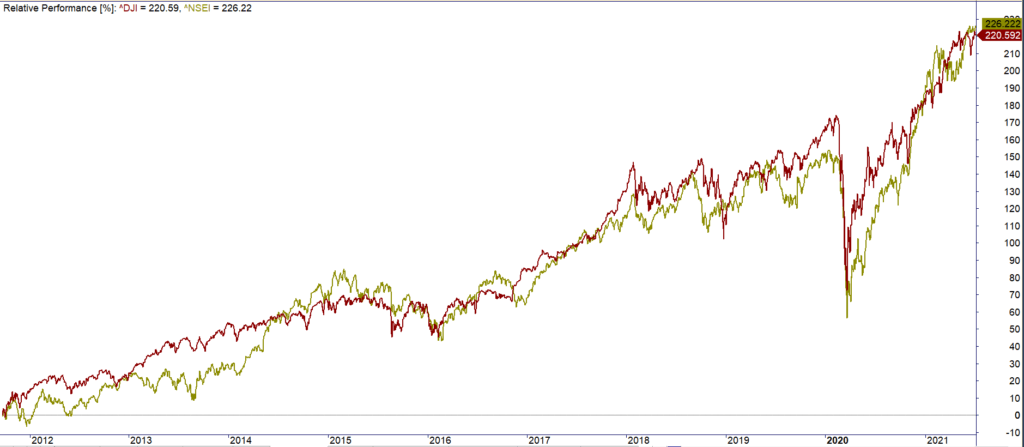
While there are enough and more reasons to be bullish on India today, the fact remains that like Siamese twins joined at the hip, we are joined at the hip with behavior being dependent on how the markets of the United States behave.
Just take a look at the 10 year comparison between Dow Jones (in USD) and Nifty 50 (in INR). Where is the Modi magic one may wonder.
In 2008, India did not have a housing crisis or were its Banks in any sort of trouble. Earnings growth was strong and the future outlook remained strongly bullish. We even had a word for the short term divergence our markets saw with respect to US markets – decoupling.
The United States was not the first country to go for massive quantitative easing. That was Japan. Will the US go the Japan way as many bears seem to suggest? In the recent past I have been trying to read more about the macroeconomic situation in Japan both pre and post the fall and my guess is that the risk of the United States going that way is fairly low.
The Japanese tend to feel shame and disgrace upon a failure such as a bankruptcy. In the United States, bankruptcy is just a way to clean out the slate and start afresh. The ideological difference cannot be more stark.
While cheap money does lead to bubbles – the dot com bubble for instance is blamed upon the easy money policies instituted by the Federal Reserve post the 1987 crash, bubbles aren’t a one year phenomenon either.
For a while now, I have been strongly bullish on the markets and continue to believe in the same. Having said that, drawdowns are one of the ways markets tend to shed off excess weights. Here is a chart that plots the maximum drawdown seen every year since 1996
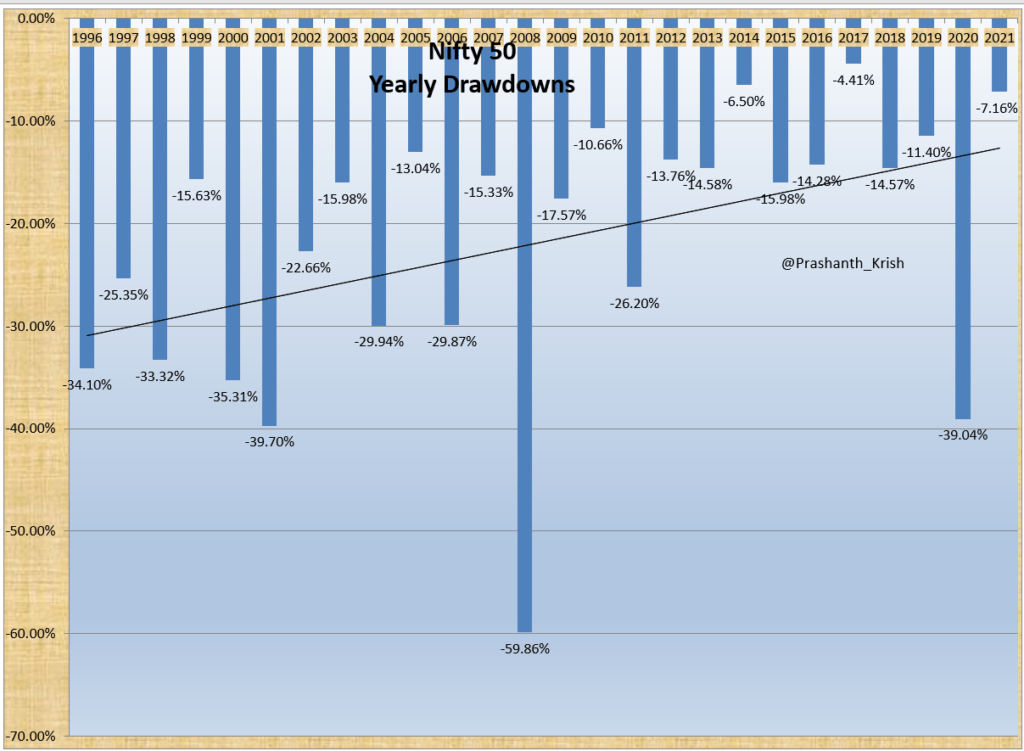
A 30% drawdown was a pretty normal occurrence in the markets pre-2008. Post 2008, it’s become a rare species. Drawdowns to me are opportunities.
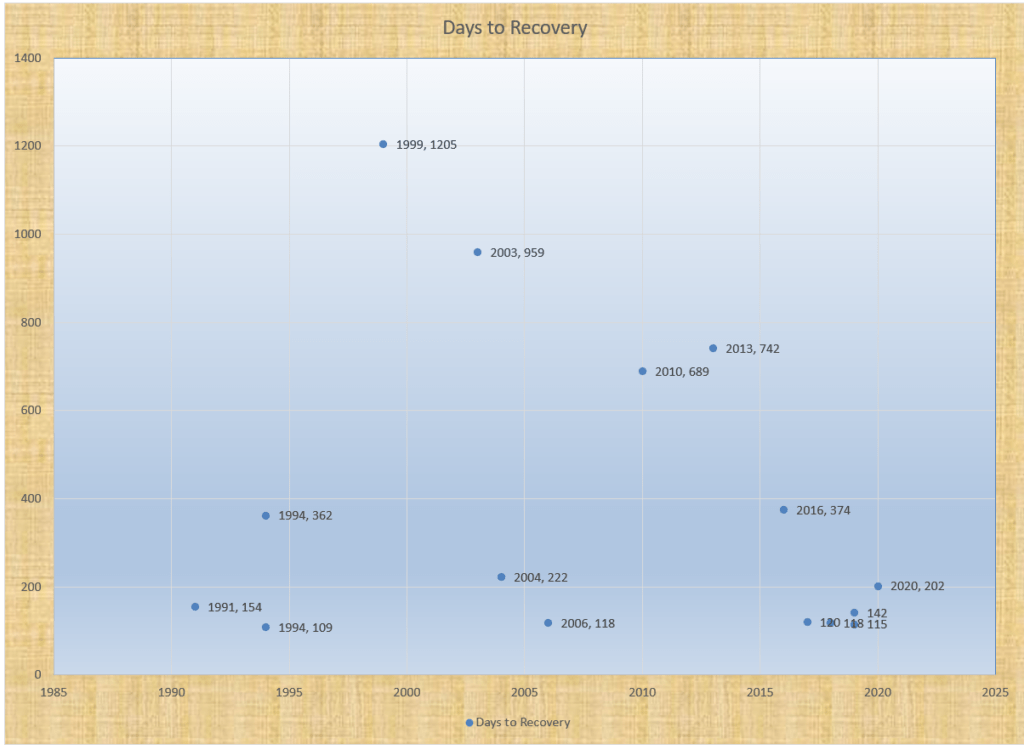
How many days does it take the market to recover and move to a new high. The above chart tries to denote that. The year is when the markets hit a new high and the time spent (trading days) in the drawdown.
The recent experience in a fast recovery from a significant drawdown is not really rare. 1994 saw markets touch a new high just 2 years after the scam had broken out and the Index had plummeted more than 50% from the peaks.
Not everything is bad though. Writing in Economic Times, Aashish Somiah writes,
Nifty earnings grew by 14% in FY21, at its fastest pace in 10 years.
Also, in contrast to the trend of downgrades seen over the last few years, FY22 and FY23 earnings estimates continued to remain steady. In fact, if realised, the FY22 earnings growth estimates of 35% as per sell-side consensus would be its highest since FY04.
I look at market breadth for they tell the story way better than what is told by the large cap indices. Across the board, markets are bullish. This is as true for Large Caps as for Micro Caps. The divergence is building up.
In early 2008, the number of stocks that were hitting new 52 week / all time highs dried up even as the indices were kissing all time highs of their own. No such divergence this time around.
There is no real play book that provides a way to play out the current scenario. Advisers generally prefer caution and advice reducing exposure as a way to limit the risks. The trade off is that if markets continue to gain, the opportunity cost could be fairly high.
A secondary way to reduce equity exposure would be to wait for the market to begin its downward march before reducing exposure. The trade off is that one cannot exit at the peak but close to 20% away from it. The advantage being that one can stay until the music has been turned off.
Of course, historically the best way has been to stick with the system and the markets come rain or shine. But we all know that, ain’t we. You don’t need to read a 1300+ word drabble to know that the best returns are those who don’t try to time every aspect of investing.
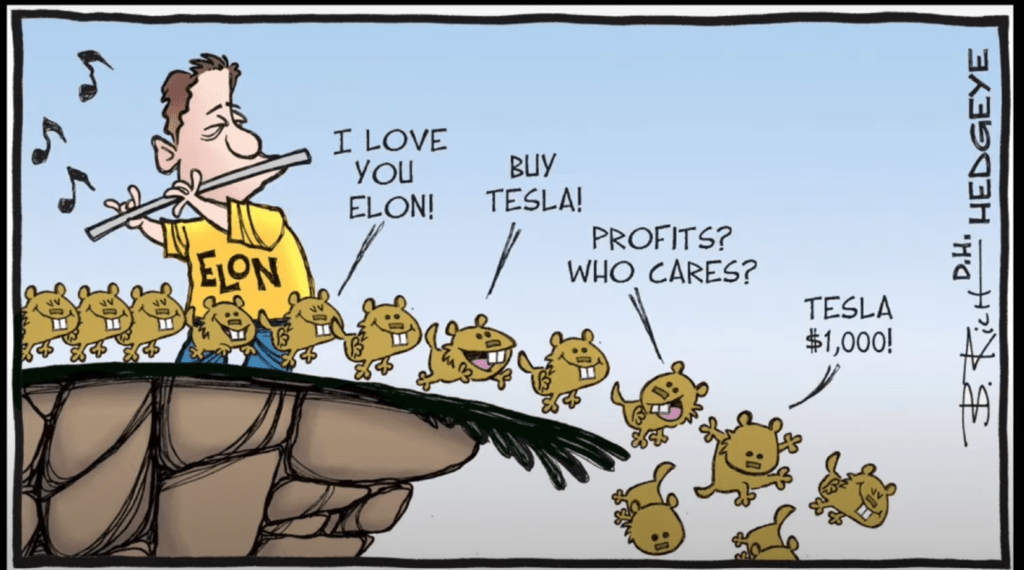
I captured this image from a video on SpaceX but I think it closely resembles the actions of majority of investors. Wonder who can the Pied Piper of Investors in India.


Recent Comments