
Throwing Spaghetti Against The Wall
This post has been driven by a deep discussion I had with Nooresh Merani today and hence the credit for the idea would remain with him 🙂
While study after study has shown that retail investors are unable to match the performance of the Index let alone beat it, it has not stopped a army of advisors and technocrats from coming up with new ideas, ways and thoughts on how to select stocks and become retire rich.
There is a very famous quote by legendary trader Jesse Livermore which goes as such
“It never was my thinking that made the big money for me. It always was my sitting. Got that? My sitting tight!”
Sitting tight is the easy thing to do when you have no real money at risk, but once you have put money, can we sit tight and hope while the stocks we have bought are moving all around. I am jumping the first step, so let me go back.
How do we create a portfolio?
A portfolio is a set of stocks we buy that we hope shall perform in the long run. But since we are provided both a price and a opportunity to trade the stocks day in and day out, its just a matter of time before we let go all the wonderful stocks we had picked (by way of Luck or Skill) while adding or at the least holding onto stocks that are touching the nadir.
The discussion I had with Nooresh was about whether a Random portfolio (contructed purely out of chance) can beat Index returns if one just invested and sat tight.
While we hope that every stock we buy ends up being a multi-bagger in the long run, its very rare for us to not just buy a few stocks that eventually end as multi baggers but actually hold them.
The test I did was simple. I took a 10 year time frame (long enough I presume for a long term investor). I used April 1, 2004 as the starting date. The date had the additional advantage of markets being near a short term top (in hind-sight) since after NDA lost the elections, markets took a steep dive and hence for at the very least 6 months from entry, we were underwater.
The biggest problem in conducting these types of tests is that finding historical data is tough since delisted / merged stocks are moved trimming the database of that day considerably. Since I maintain a database where delisted stocks aren’t deleted, it made it a bit easy for me to work on the approach I had decided upon.
I took the Bhavcopy of NSE of 1st April 2004. On that day, 750 stocks were traded and I removed 250 using the filter of removing any stock that had closed below 25 on the previous day (Idea is to remove penny stocks).
I then used Random function in Excel to randomize the 500 that remained. I then selected 3 sets of 25 stocks each from them (1 set each before refreshing and randomizing the set of names again – and hence a couple of stocks do repeat).
I then used the Opening prices of these stocks as per my database (where its adjusted for Bonus / Splits but not for Dividends) so as to get the current average price of acquisition. All acquisitions were assumed to be equally weighted (same money invested in each stock)
So, how did the three perform compared to Nifty. Well, here you go
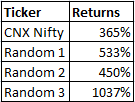
Every Random Portfolio beat the CNX Nifty. Is it Luck? Maybe to an extent, but what drives a diversified portfolio is if you can get caught with a few multibaggers. Regarless of how badly a few others do, since the exposure to each stock is 4%, not much of damage can happen while the ones that click big shall make more than what they lost (worse case, you lose 100% in a stock. If one stock moves 400%, it makes up for the loss of 3 of them).
I am not suggesting that you need to buy stocks randomly, buying good stocks is said to make a lot of money, but unfortunately we come to know of good stocks only after they have bolted off the stable (hindsight).
Food for thought?
File if you need to download (Link)


Hi Prashanth…
You delet the stock that are below prise of 25 ? M i right ? But your Excel file shoving the Stock which are below 25 Rs.
Those are adjusted prices (owing to Stock Split / Bonus etc). Infy (did not come up in my random screener) has so many Bonus Issues that the average price for the Original investor would be very low compared to what he actually paid
oh .. ok ..!!! I think, in recent days, you are focusing more and more on “Probabilities” 😉 .. m i right ??
Yep. My current fad if I were to say 😛
You rarely reply to my emails 🙁 so here I write :-). Very brilliant idea to do this kind of study, I guess in 2004 except PSUs and Auto rest whole market was dirt cheap just marginal up from 9/11 valuations. If you change period to say even 1-Apr-2006 (midcap/smallcap PE peak) result will be completely different. Also as correctly said by you diversification helps wherein some stock gives super normal return (e.g. Shree cement, Infotech Ent, Titan) even after assuming some stocks getting de-listed.
Apologies will be in order if I have omitted to reply (do have a very short time span of attention 🙂 ). I agree, stocks were comparatively cheap (though not really cheap as in mid 2003).
I do intend to do the same random study choosing every year (2004 to 2012) and see how the results would have been.
Just on a gut feel, I believe you shall see more years with portfolio coming on tops than years where you would have lost money. But the proof of the pudding is in the eating & unless one discards the need for a story before buying a stock, its tough to emulate such strategies (human nature and all that 🙂 )