
Nifty Update – time for a correction?
Its been quite some time since I wrote my view on Nifty, not that anyone would care if I wrote or not, but then again, writing a blog post is the easiest way to record one’s thought at that particular point of time.
We saw the first major move in Nifty in October of 2013 when it moved the closest to the all time high on Nifty since 2010. But it took another couple of months for a new high to be set and while we did set a new all time high in December, there was no follow up action and the Index gave back much of the gains over the next couple of months.
A clear cut break-out though was witnessed in March and the Index has not looked back ever since. While the trend remains unequivocally bullish, we need to question as to whether the markets are finding the path of least resistance on the down-side against the expected continuation of the trend on the upside.
8000 is the level that most Investors and Traders seemed to be focused on. But like a magician, markets have this unique ability to spring out a surprise that is least expected and one needs to be wary of the same.
A bull market is seen as having started after the markets breach the previous all time highs and in that affect, we are at the start of a bull market since the breach of 6350 is just 4 months old. But then again, if one goes back to the 2000 bull rally, we saw the break of the 1994 high in December 1999 and were re-testing and breaching the break-out point as early as April 2000.
While hindsight informs us that the rise and fall was all due to the euphoria we saw in IT stocks (Indian markets did not have Dot com companies listed in the way Nasdaq had), at the point of time, many a investor and trader were left wondering what was happening as they saw their portfolio haemorrhage as stocks fell across the board.
Of course, things are not as bad as they were in 2000 or in 2008 (start of the year), but we have seen stronger reactions in markets without they having to reach the exuberance stage – Example: In November 2010, markets topped out at 6338 and found its final bottom only in December of 2011 at 4531, a correction of 28%, not something to ignore.
So, without any further ado, let me present charts which seem to suggest that it may pay to be careful and not get caught with the excitement shown by market participants and TV / Twitter pundits.
My first chart is of the Nifty PE with Average and Standard Deviation plotted. Do note that the PE is from Standalone results of the trailing four quarters and if one were to use Consolidated results, the current PE may seem to be lower than what this graphic shows.

The PE chart above shows that while markets are nowhere close to where they were in 2008 or 2004 or the recent 2010, we are at a point which is pretty close to the 1 Standard Deviation (last time we were at a similar PE level was in June 2011 when Nifty was trading at 5650. Shows how much of a improvement we have seen in the earnings).
While the positive fact as outlined above is that we aren’t by any stretch overly expensive, we are beginning to get there though there is still ample time before we see similar levels (assuming no change in earnings, Nifty needs to move by 36% from the current level to match that of Nifty 2008 exuberance).
On the negative side, the fact that we are the most expensive among BRIC and Emerging nations (most, measured via CAPE) does mean that we need to see how fund flow will behave in the coming weeks / months. With big IPO’s lined up, chances of they sucking out the liquidity from markets remain high too.
When markets start of top out, the first signs are visible in the broader markets which fail to match the big boys and start to show signs of decline. In the following chart, I have lined up a composite of stocks trading above their 200 day EMA, their 60 day EMA and their 10 day EMA.
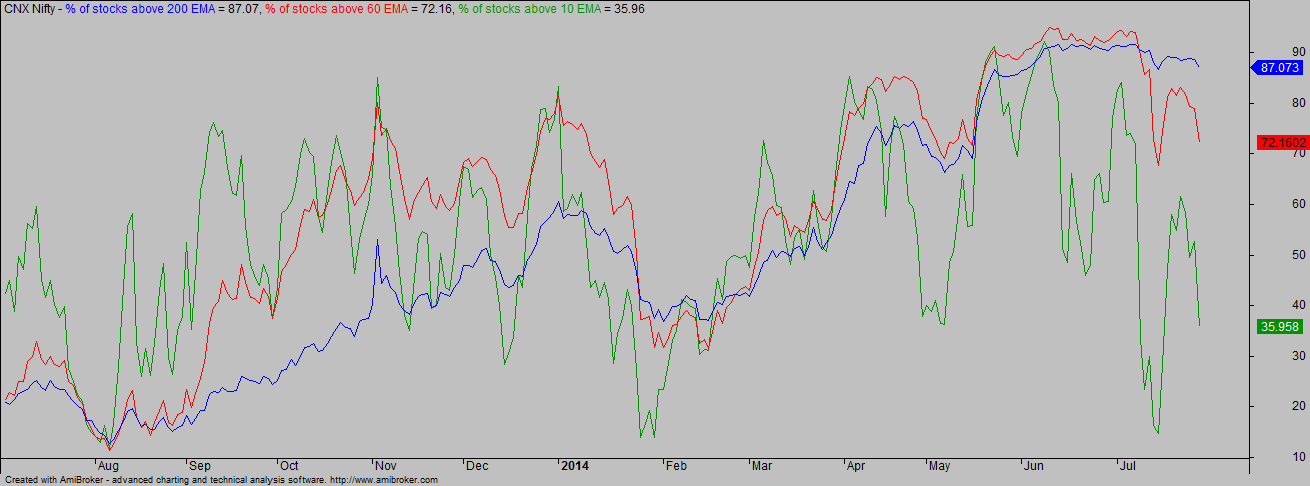
There is not much of a damage in terms of stocks above 200 day EMA. But then again, that is to be expected since we are yet to see even 1 week of decline and markets have made their new high today too.
The 60 day (representing approximately 3 months) seems to showcase some damage as it not only was unable to make a new high when markets rallied in this week but its trending down too.
The 10 day (representing approximately 2 weeks) shows the maximum damage as it moves lower. Do note that on 14th of this month, when Nifty made its recent pivot low, the percentage of stocks above their 10 day EMA was as low as was seen in February of this year (just before the markets took off).
This kind of divergence happens all the time, but since we are seeing it happen even as markets have made a new high makes it more worthy of noting.
The next chart showcases the number of days since we saw Nifty testing its 50 day EMA. In the great bull run of 2003-2008, the maximum number of days which Nifty was above the 50 day EMA was 130 days (in 2006). Currently that number is 105 but more worthy a point to note is that the 50 day EMA itself lies 7481 and it would take a reaction of 300 odd points (or passage of time wherein the EMA will creep higher without a requirement there being any major fall in the intervening period).

Major cracks in markets happen when exuberance is high and unfortunately we don’t seem to have any data in that regard. The US markets which too have been on a strong upward trajectory has its AAII Bullish and Bearish sentiments are nowhere their high / low points.
Technically, today, we broke back below the recent high making a small double top in the process. But whether its a valid signal (due to the low amount of time spent between those two tops) make is uncertain as to whether we have topped out for the medium term (long term trajectory is very much up and I doubt it changing anytime soon).
Bank Nifty has been one of the laggers in the current rally and the way it moves may dictate the future of Nifty as well. If Bank Nifty breaks and closes above 15750, we are back on the bullish bandwagon, but if it instead breaks 14300, it would be good bye to bulls, at least for a few months if not more.

Recent Comments