
Nifty – Are we in a bubble / nearing a peak?
While we are once again testing multiple year highs, a question that was raised by a friend on twitter is whether stocks were up (rather participating) across the board or was this due to a few select stocks moving up the Index.
While there are various ways to check, I have chosen the easiest way. Using the list of stocks that composed Nifty as on 8-11-2010 (the last major high for Nifty before this series of tests), I calculated the moves of each of them till 11-03-2014 (recent day when the Nifty made its all time high).
An Index is just an Index of multiple stocks and hence there is no way that all of them will be outperforming Nifty. What would be interesting to note is how many outperformed Nifty (more the healthier) compared to those that under-performed.
The difference of Nifty btw the above dates comes to 3.80% (amount of gains since its last major high). Of the 50 stocks that comprise Nifty, we saw 21 stocks outperforming that with average gains coming in at 47.50%. 1 Stock was positive though it under-performed Nifty. 27 stocks gave negative returns with average return being -37.40%
Nifty is calculated on basis of Free Float. If one had instead invested unformly in Nifty Index as on 8-11-2010, as on date the gains would have been 0.82%. The difference of 3% in returns would be due to 2 factors
1. We would have given more weight to under-performer as compared to weight in Nifty and same would have held true for out-performer as well.
2. The Nifty value (end value) I am using is that of of Nifty which consists of 5 stocks which were included into the Nifty after November 2010. They being better performers would have contributed in a small measure as well.
Despite markets at all time highs, this is not a bubble as is evident from most people denying that markets are bullish as well as there being no euphoria in the retail investor arena.
Finally a couple of charts
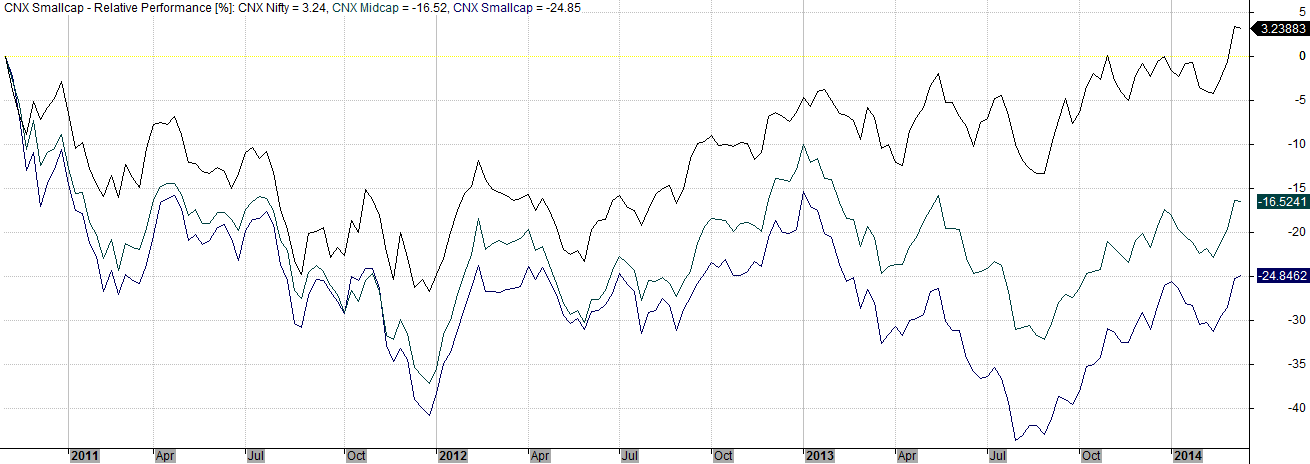
Here is the performance (relative) of CNX Nifty vs CNX MidCap vs CNX SmallCap. See how Mid Caps and Small caps are strongly under-performing the main index
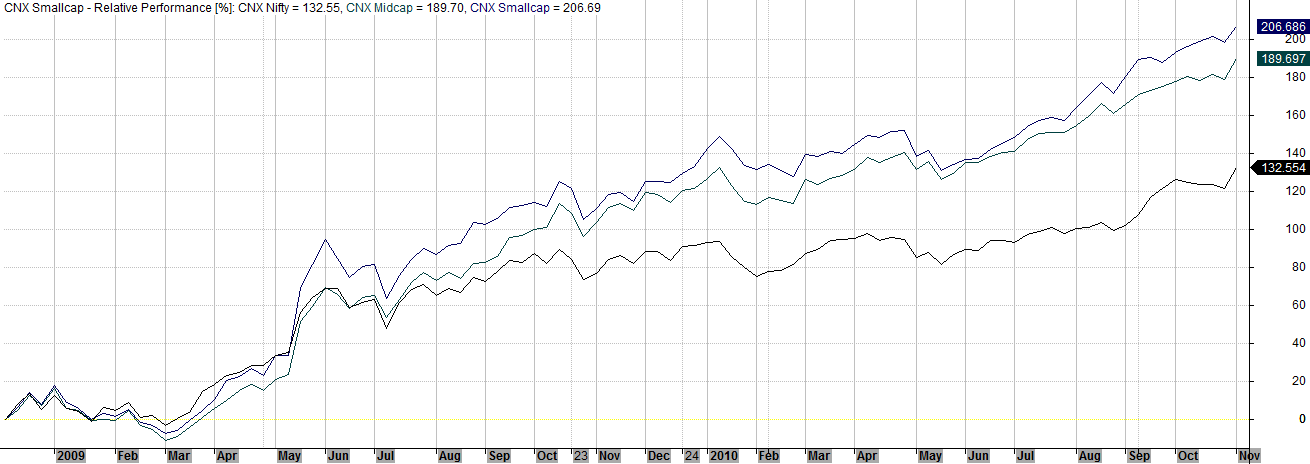
Here is the same comparison between 2008 (low) and 2010 high
and finally performance between 2005 (July) to 2008 peak
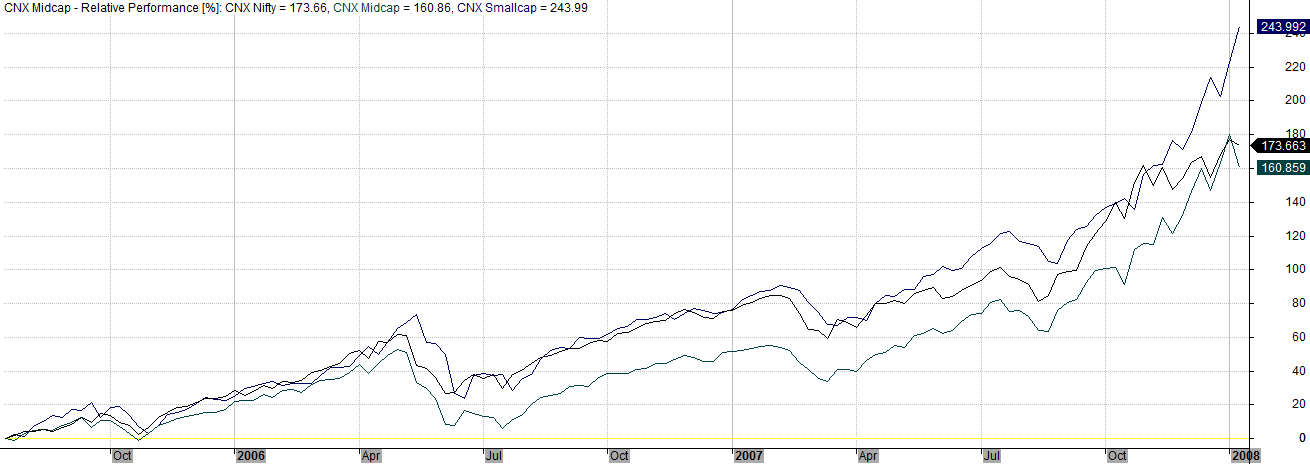
Notice how small caps were performing prior to the peak. Comparatively, this time around we are far from any such performance. While my own thought process is that we are unlikely to see a multi year bull run from here, that would not stop Nifty from moving to 7000+ or even 8K levels before turning around.
As long as the markets are bullish, I believe one should be biased towards long rather than trying to pick the top and missing the whole rally. To me, there is only one way to approach the markets. Be long with a plan B of where one would get off if the trend starts to reverse. Prediction is Impossible and attempting that is a fools errand.

GOOD