
Sector Index Performances in India – April 2014
nimble-builder domain was triggered too early. This is usually an indicator for some code in the plugin or theme running too early. Translations should be loaded at the init action or later. Please see Debugging in WordPress for more information. (This message was added in version 6.7.0.) in /home1/portfol1/public_html/wp/wp-includes/functions.php on line 6121restrict-user-access domain was triggered too early. This is usually an indicator for some code in the plugin or theme running too early. Translations should be loaded at the init action or later. Please see Debugging in WordPress for more information. (This message was added in version 6.7.0.) in /home1/portfol1/public_html/wp/wp-includes/functions.php on line 6121
I am not a great fan of Chart Reading. Its like evaluating a painting, I may like one style and you may like another. Even technicians admit that what they see may not be what the other guy sees and since the probability of being right or wrong is always 50%, its no wonder that some one has to right and that in itself is shown as the reason why chart reading is a great asset to trading.
Biases are unfortunately ever present when it comes to skills where you cannot prove it to be wrong or right. Hence while everyone has to agree that 10 + 10 = 20, a single chart maybe read in any number of ways depending on what the chart reader assumes it to be showing / implicating at that moment of time.
For example, look at this chart picked from here.

The author uses the chart to explain why his bearish bias is correct by showing how the Risk Appetite Index has broken a trend line and indicating a reversal of the current trend. But is that the correct way to read the chart?
The Index has twice dipped strongly. The first time was in June 2012 and the same has been marked. But that was the low for the market (and in hindsight, for the foreseeable future). Second was even more of a deadly drop in March 2013, but Index seemed to care a boot as it accelerated upwards through the year.
No strategy has a 100% win ratio (other than Bernie Madoff ofcourse 🙂 ), but unless its thoroughly tested and its faults known, one is better off not using / knowing such a strategy rather than use something that just feeds our bias regardless of it working or not.
There is a wonderful quote from the Oracle of Omaha wherein he says
Wall Street is the only place that people ride to in a Rolls Royce to get advice from those who take the subway.
Its amazing how true that statement is in the financial field while not being true in any other profession. For example, the other day, a friend complained about pain in the ear. My initial thought on that subject was that the probable cause was it being a infection and the remedy would be a cheap anti-septic ear drop. But my friend decided that he was better off consulting a specialist (and I do agree with that 100%) since I am no doctor to advise and we all have heard about how dangerous self medication can be.
If a light bulb burns out, generally some one in the house easily replaces it but if a switch got burnt or broke, more time than usual, a electrician is called in to change the switch despite the job being no risky than changing the electric bulb. The reason is simple – the probability of getting a electric shock if you are dealing with a open wire is much higher than one that can be caused when changing a bulb.
But when it comes to advise in the markets, its amazing how all and sundry can make an impact and how easily we fall prey to such advise. One reason for that I believe is that the pain that is caused by financial loss has a much lower impact than one caused by say a electric shock. If you try to do some thing and get a electric shock, the probability of you trying to do the same thing once again is much lower compared to doing the same thing in markets where we just tell ourselves a new story as to why the previous tip based trade failed and why the current should / shall work.
Statistics tell us that the probability of a failure for a trader is pretty high, yet that seems to make one more deterministic about how we are better than those other failures and why shall win this time around. Having been a full time active participant in the markets for more than a decade and a half, the one reason I can see for that is the fact that many are successful in their own fields and wonder why cannot they be here where the odds seems reasonably low in comparison.
For instance, to be a professional in any field, one needs to study and excel for at least 5 years while to be even worthwhile to enter the said field while to be a trader / investor, all one needs is a PC. Most have little knowledge about the company or even the methods they claim to follow. Have talked to many traders who claim to use technical analysis but cannot distinguish between RS and RSI let alone explain how they are constructed.
Of the guys who I have seen as having succeeded in markets, the one thing that has been common among all of them have been their devotion in terms of time and energy. All of them are full time traders / investors whose bread and butter is from their trading / investing activity and not Salary / Brokerage / Business or the trading being a part activity after retiring from full time service elsewhere. This in a way compels them to be either successful or find another profession (and as elsewhere, Survivorship bias does have its way even here with many who did devote full time too failing).
The reason for advisory services to have a field day in the stock markets as compared to elsewhere is that a lot of times, you just have to be lucky to be right and if markets are on a one way trip, it makes it even better if the markets are trending since then the odds of the stocks moving in favor of the trend remains high.
Of course, picking a few odd stocks cannot be a way to build wealth, but then again, who cares since the brain has this innate ability to think positive and multiply one good trade due to luck into a series of good trades. As Benjamin Graham said and I quote
In the short term, the stock market behaves like a voting machine, but in the long term it acts like a weighing machine
Luck can be of help in the short term, but over the long term, skill outclasses luck (think about the 10,000 hour rule made famous by Malcolm Gladwell. You can make some money i the short term by paying for tips / newsletters and seeing some of them succeed as well, but if you really want to succeed in the long run, the key requirement is that you are hungry for it and make it your business to know anything and everything there is to know about a business.
A popular adage in the US markets is “Sell in May and go away”. Over at All Star Charts, JC Parets wrote one showing the huge discreprancy in returns between buying in November and selling in April vs buying in May and selling in October. I decided to check whether Indian markets showed any such trends.
I tested the same on the Sensex for the period from 1st Jan 1981 to 23rd April 2014. The results though show that there is not much of an advantage for a investor to miss the months through May to October.
An investment of 10,000 in the Sensex is assumed on the first day of Jan 81 for Sell in May strategy. and 1st May of 81 for Buy in May strategy. Results are as here under

The difference is not too much between those periods signifying that selling in may and going away makes no sense since you shall leave a large part of the market appreciation on the table (or at least, that is what the back-test conveys)
The reason for this can be seen in the Monthly gains chart of Sensex. As can be seen below, good and bad months are spread all along. A Sell in May strategy misses the best month of September while the reverse strategy would miss out on the gains one sees in December and April.

May on a whole has been negative and it would be interesting how it behaves in the current month especially with results of the election being declared. A dip seems to suggest a buy with a exit target in September
In my last post titled “Throwing Spaghetti Against The Wall” I showed how after picking up 3 portfolios whose stocks were randomly picked, I could still beat the overall return of the market over a time frame of 10 years.
In continuation of the same, I decided to to a double blind test on picking random portfolios and comparing them to the returns Index gave. I randomly selected 1 date in a year and on that date randomly selected 25 stocks (all done through Excel so as to avoid any bias creeping in).
I did it for the years through 2005 to 2010. The results can be downloaded from here (Link). To summarize the same, Random portfolio created beat the Indices in 3 out of the 5 years, in 1 year it under-performed Nifty and Mid-cap while out-performing Small cap Index and in one year has under-performed all other indices.
But if one were to take the final tally, the net results beat the results of all three indices comfortably.
The question that comes thus is, is it a real waste to spend time, energy and money trying to analyze companies? Well, to me, it isn’t so if you believe that you are the 5% of the achievers when the rest of the 95% under-achieve. But if you aren’t sure and your bank balance (from trading / investing and not Salary / other Income) doesn’t seem to show that, its not too late to admit and get back to doing what we do best.
Do note that the only filter I have used was to select stocks that had closed the previous day above 50. It did not matter for me whether they were bullish / bearish based on technical parameters or whether they were fundamentally strong or not based on value analysis. Its pure random selection.
The reason why its tough to believe and even tough to implement this in real life is that we are all suckers for stories. We want a solid reasoning (that resonates with our mind) that comforts us that despite the fact that our investment is deep under water, its not we who are to blame but market forces and the desertion of lady luck.
The whole financial industry is build on this story that you can be better than the markets though not everyone can be above the average (statistically impossible, eh? ), the story has takers (as can be evinced from the number of Mutual funds to PMS to Hedge Funds who offer to take care of your money for a small fee).
In US, it seems for the first time in decades (if not more), people are finally getting out of active strategies and investing into passive ones (ETF’s that provide market returns with minimum fuss and very low charges). Here in India we do lack the spread of ETF’s that are available in US, but I believe that over time, we should see more and more ETF’s hit the market and that would enable investors to invest without having to pay through the nose and yet end up with more or less the same return (or heck even lower).
The reason random portfolio works has nothing to do with selection (after all, we aren’t selecting) but with the concept of compounding. If you were to look at the excel sheet, you shall notice that its not the number of winners that count, but the returns outliers have been able to deliver.
For example, in the portfolio of 2009, the biggest winner was Vakrangee Software. This one stock was able to return the whole capital in affect making the other 24 stocks free.
Warren Buffet has made his money not because he was able to pick all the right stocks, but because some of the stocks he has picked has been multi-baggers to a extent that it wipes off the losses of the few stocks (or should I call business since he having grown so big rarely picks up small stakes and instead wants to get fully into the company) where he called it wrong (and he has several wrong calls).
Markets grow in fits and starts, but in the long term, growth is there for sure (unless you believe that the India story is done with and we shall see a phase such as one seen by Japan). Long term some business will grow at a pace more than others and if we are lucky to have them in our portfolio, our returns should at the very least equate to market returns and at best out-perform the other asset classes easily. And all this without having to burn mid-night oil on what stock to buy, when to buy, when to sell and a thousand other loaded questions.
And before I conclude, do read about how funds rated as Gold can under-perform and many rated neutral / negative outperform (Link). If companies that spent thousands of man hours analyzing in depth funds cannot distinguish the bad apple from the good, what are the chances we can?
Over the last 6 months, it has been quite evident that even as the Nifty is booming higher, not all sectors are participating with it. IT which had a real good run has been on slipping quite a bit. So, the question is, what sectors are driving the current rally. As you can see in the correlation matrix below, the best performance has come in from Services sector and the Finance Sector. While IT leads the laggards, Media sector too has not had a great run.

The best way to use this sector matrix is to compare how the sectors behaved during a bull run and how they performed during a bear phase and then use the same to allocate accordingly. Lets for a start see the correlation between the same sectors and Nifty when shit hit the fan and markets slumped down during 2008

The surprise for me was the low correlation of Small Cap with Nifty. This despite the fact that taken on just values, small cap fell more than what Nifty did. But as my good friend, @Jace48 tells me, its the order that is important rather than the overall change and hence the low correlation. To test this a bit further, I created a 20 day running correlation between the same (same set of dates) and the chart below points out to how the indices did not trend in a similar way.

And this is how the same sectors performed during the pull-back we saw in 2008 / 2009 (exact dates being 06/03/2009 to 06/01/2010).

And finally, lastly but not the least, Correlation during bull market – Correlation during bear market
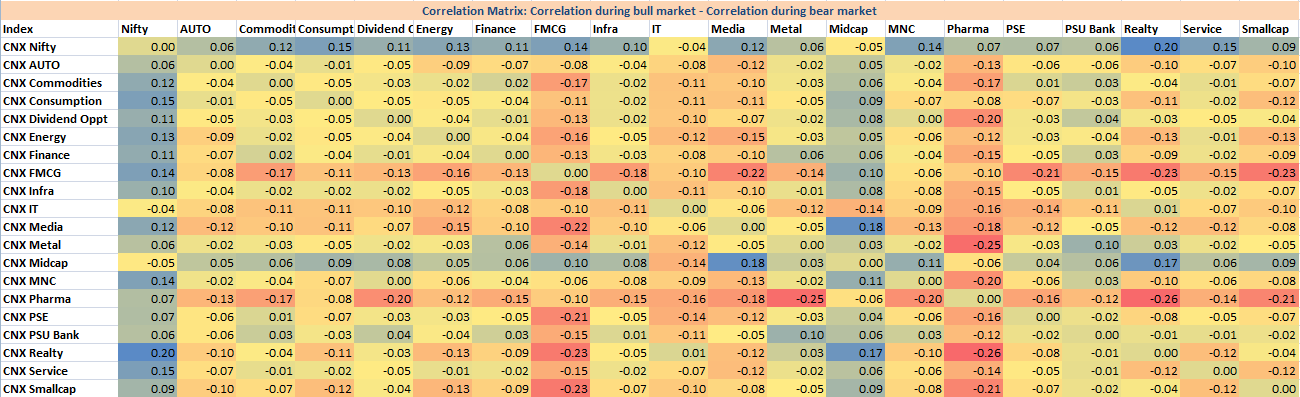
While I was working on ways to present the data I had compiled, the above presentation was based on a article I found on bespokeinvest