Roundup of Five Years of Momentum Investing
While everyone wants to take the road not taken, safety lies in the road everyone takes. Fund managers would rather be called out as closet managers than be criticized or worse fired for striking a new road which unfortunately did not lead to expected returns.
Momentum has been around for a long time if you were to consider evidence from the world of Technical Analysis and yet other than in recent times, there was no real interest in pushing this as a way of investing.
In most parts of the world, Momentum Investing is seen as buying stocks where one is looking at Momentum in Earnings. In India, much of Momentum Investing is basically betting randomly on stocks that are going up. While both strategies have their positives and negatives, the one that got me interested was more with respect to price based momentum but where rules are defined.
The biggest advantage of quantitative momentum lies in the simplicity – both in the approach as well as in execution. While the original rule has been slightly tweaked, the strategy that was worked out 5 years back is still working fine as a fiddle.
With the rebalancing being monthly, what this means is a lot less stress. While shorter rebalance periods have their advantages, one that really showed its worth in the month of March 2020, the trade off is a lot more churn and impact costs that add up over time.
Evaluating a Strategy
At the beginning of 2018, a fund manager who was practicing a strategy that was not inline with what most investors believe was having a gala time. His 5 year CAGR was a mind blowing 43%. A 40% return will have you owning the entire stock market in ~60 years (Link)
It’s been 4 more years since then and the calculations seem to suggest that the high of 2017 is yet to be broken. The 9 year CAGR is now 20% – not bad but only if one had invested in 2013. An investor from 2017 would be barely breaking even.
So, what is a reasonable time to evaluate a strategy that goes against the grain of thought? Meb Faber says it should be a minimum of 10, better 20.
Or take this view expressed by Jim O’Shaughnessy in his Masterclass book, What works on Wall Street
Short Periods are Valueless
Consider the “Soaring Sixties.” The go-go growth managers of the era switched stocks so fast they were called gunslingers. Performance was the name of the game, and buying stocks with outstanding earnings growth was the way to get it.
In hindsight, look at how misleading a five-year period can be. Between December 31, 1963 and December 31, 1968, $10,000 invested in a portfolio that annually bought the 50 stocks in the Compustat database with the best one-year earnings-per-share percentage gains soared to almost $35,000 in value, a compound return of more than 28 percent per year. That more than doubled the S&P 500’s 10.16 percent annual return, which saw $10,000 grow to just over $16,000. Unfortunately, the strategy didn’t fare so well over the next five years. It went on to lose over half its value between 1968 and 1973, compared to a gain of 2 percent for the S&P 500.
More recently, the mania of the late 1990s provided yet another exam- ple of people extrapolating shorter term results well into the future. Here, it wasn’t “gunslingers” pouring money into just the stocks with the highest gain in earnings, but rather new-era disciples pouring money into Internet compa- nies that in many instances had little more than a PowerPoint presentation and a naïve belief that they were going to revolutionize the economy. In both cases, things ended very badly.
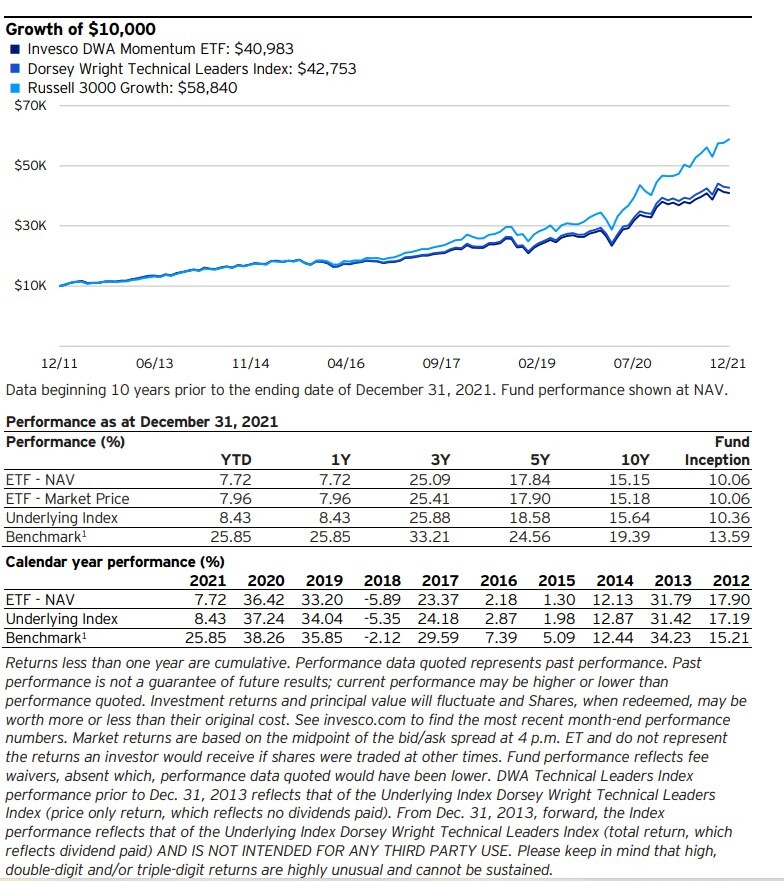
The oldest Momentum ETF in the USA is Invesco DWA Momentum ETF which started off in March 2007. The performance though has been severely disappointing with the fund being beaten by its chosen benchmark literally every year in the last 10 years
iShares which launched its own Momentum ETF in 2013 has done slightly better but still underperforms Russell 1000 Growth since Inception.
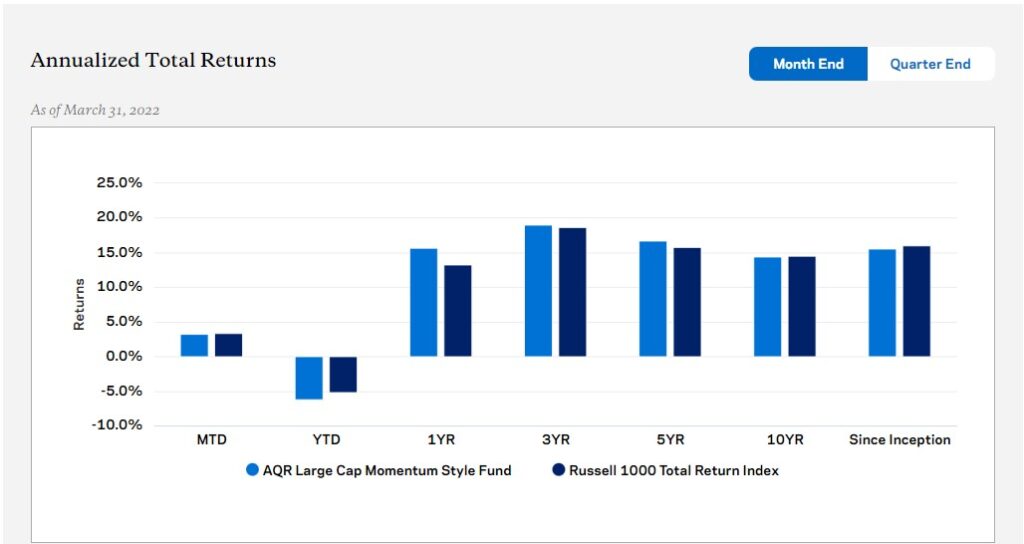
AQR Large Cap Momentum Fund has underperformed the same benchmark since inception though last year the fund did slightly better vs the Index.
On the other hand, the recently launched UTI Momentum 30 Index Fund has more than comfortably beaten Nifty 200 (which is a good benchmark to compare against).
Does this mean that Momentum works better in India than in the US?
Corey Hoffstein had this to say on why Momentum in US has lost its Mojo in recent times
At any given time, approximately 31% of our portfolio is allocated to a basket of high momentum U.S. equities. Within the context of the broader portfolio design, this sleeve seeks to generate alpha, particularly during bull markets. Unfortunately, since early 2021, it has dramatically underperformed the S&P 500
What makes momentum distinctive, as a factor, is that it is a chameleon. If quality stocks are doing well, it may buy quality. If expensive, junky stocks are doing well, it will buy expensive, junky stocks. If the stocks of companies who have CEOs that have red hair are doing particularly well, it may buy those stocks, no questions asked.
Momentum in India too will face the same issues at some point of time in the future. It’s a feature of momentum and not a bug.
While it’s too early to call, the fact remains that while Indices may showcase strong returns, the ability to replicate it without transmission costs (read as tracking error) is not yet fully tested. Recently Nifty Alpha 50 had included stocks that on the day of rebalance were frozen in upper circuit limiting the ability of the ETF’s that track it to buy the same. Misses such as these will overtime widen the difference between Index and the ETF.
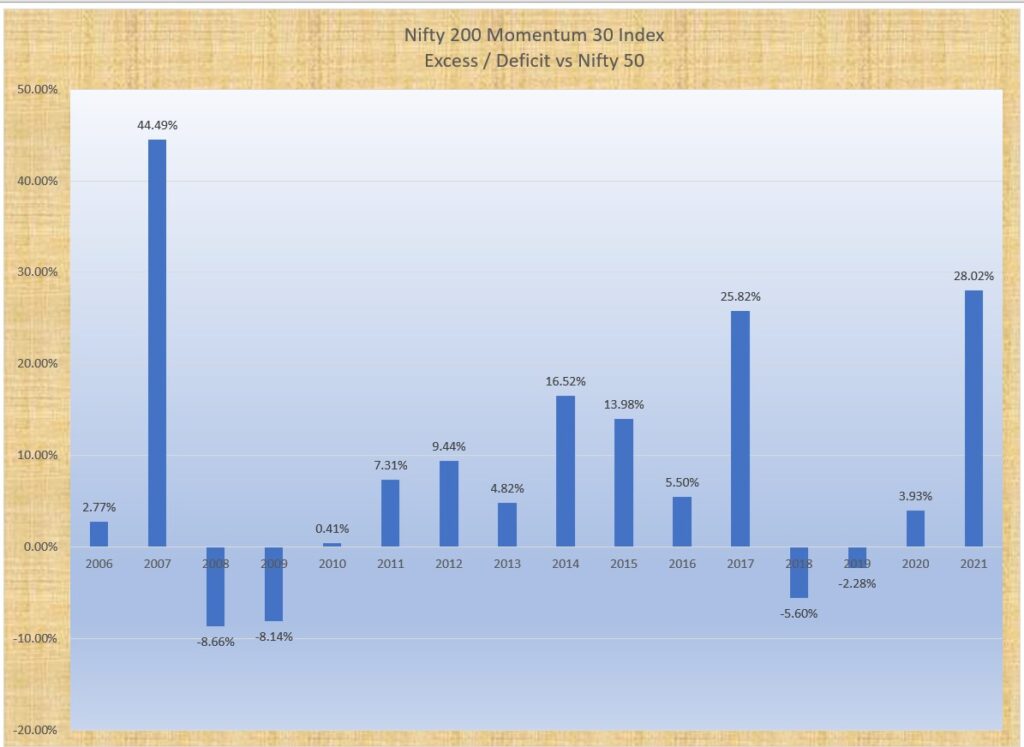
Here is the yearly divergence in percentage terms of Nifty 200 Momentum 30 Index vs Nifty 50. While 2021 was an outlier, the Index has performed massively better over time with few exceptions.
Lets go a step further and add Nifty Small Cap 100 Index Returns (again, the difference and not the absolute returns).
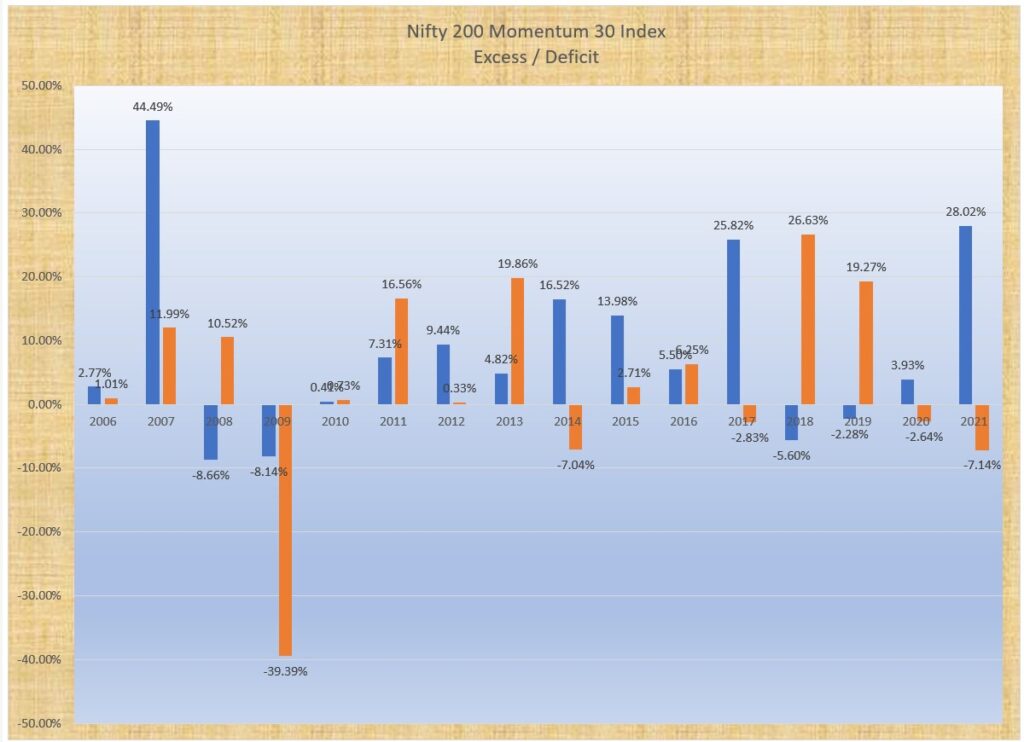
Given that the philosophy and even the strategy is pretty similar, it’s doubtful that Indian stocks are better acclimatized with respect to Momentum vs in markets such as the US. What we are seeing especially in the case of UTI Momentum 30 fund for example could be a case of one off years that happened to be the first year of its existence too.
In almost all strategies, Size is a constraint and this can be a real killer for almost all strategies. From Warren Buffett to Peter Lynch, their Alpha deteriorated once the AUM started to go beyond a certain size.
Compared to Value strategies which have a low level of churn and hence higher allocations can be done over time, the same is not true for Momentum since the holding period can be quite short and one would want to enter and exit without either delay or moving the prices due to our own actions.
Take for instance a stock that has a daily trading value of 1 Crore (Shared traded multiplied by the Price) on any specific day. If one is a Momentum Investor, it’s unlikely that you can buy or sell anymore than 10 Lakhs at maximum without distorting the price.
So, how many stocks will fit the bill. Do note that the data is of current and current volumes as I shall show later on are much higher than what they used to be.

Assume you have a 20 Stock Portfolio with equal weights. So, at 1 Crore Capital, you will buy 5 Lakhs of a stock. If you want to buy no more than 1% of a stock’s daily volume (note that the delivered volumes are actually much lower), you have just 753 stocks to choose from. If you are willing to stretch that and buy say 10% of a stocks volume, this expands to 1373 stocks out of the total stocks of approximately 1800.
While Individual Investors have small capital, this doesn’t seem to be an issue. But if money is being managed, this can and is definitely an issue. The higher the AUM, the lower the number of stocks that are available.
This was an issue that was addressed even by Warren Buffet. His quote,
“If I was running $1 million today, or $10 million for that matter, I’d be fully invested. Anyone who says that size does not hurt investment performance is selling. The highest rates of return I’ve ever achieved were in the 1950s. I killed the Dow. You ought to see the numbers. But I was investing peanuts then. It’s a huge structural advantage not to have a lot of money. I think I could make you 50% a year on $1 million. No, I know I could. I guarantee that.”
Warren Buffett
Of course, you can buy a greater quantity of a particular stock but as Bill Hwang experienced, at trading in large volumes on a given day – at percentages of more than 10% to 15% of the daily trading volume of a specific issuer – would create upward pressure on the share price and often result in the share price increasing.
The problem accelerates when it comes to selling for it works in reverse. You can always say, I shall sell over a period of time but remember, Momentum stocks are sold when they have lost Momentum. This means that the stock that one is exiting is generally weaker in the short term and a strong pressure of selling can topple it more than what it would have done without that gust of selling.
This is a problem that confounds not just Momentum players. ARK through its multiple ETFs has managed to accumulate a large percentage of equity of stocks that got pushed up because of their own buying. Now that money is on the way out and the only way to raise funds is to sell the same stocks for otherwise they will become too big a percentage of the portfolio, the same are now toppling back at double speed.
Advisories are able to get around this issue by just counting the model portfolio returns. Question though is, how much are the clients making? Given how many low liquid stocks make it to the portfolio and orders placed at market, my own guess is that it’s big enough to make a dent. In bull markets, these things are easy to ignore but can markets be bullish forever?
Smallcase recently changed the way it calculates returns and portfolio returns showcased suddenly saw a big spike down. One small case I tracked fell 25% in a day. But one wonders, is even that number a reality?
Slippage is an invisible killer. It doesn’t show up on your contract note but can damage more than Taxes and Fees put together.
Performance Data
On my personal account, I have been trading using Momentum for the last 5 years. What started as an experiment is now the whole and sole manager of my equity exposure. The figures, tables and charts below are based upon that data.
Monthly Returns
I have been posting personal monthly returns on Twitter since August 2019. The idea of posting came from the way CTA’s in the US post their monthly returns. A major reasoning though is to showcase that Systematic Momentum can deliver the goods. While we lack the narratives that accompany other strategies, the final arbiter being returns, I hope that a long term performance record inspires others

Rolling CAGR
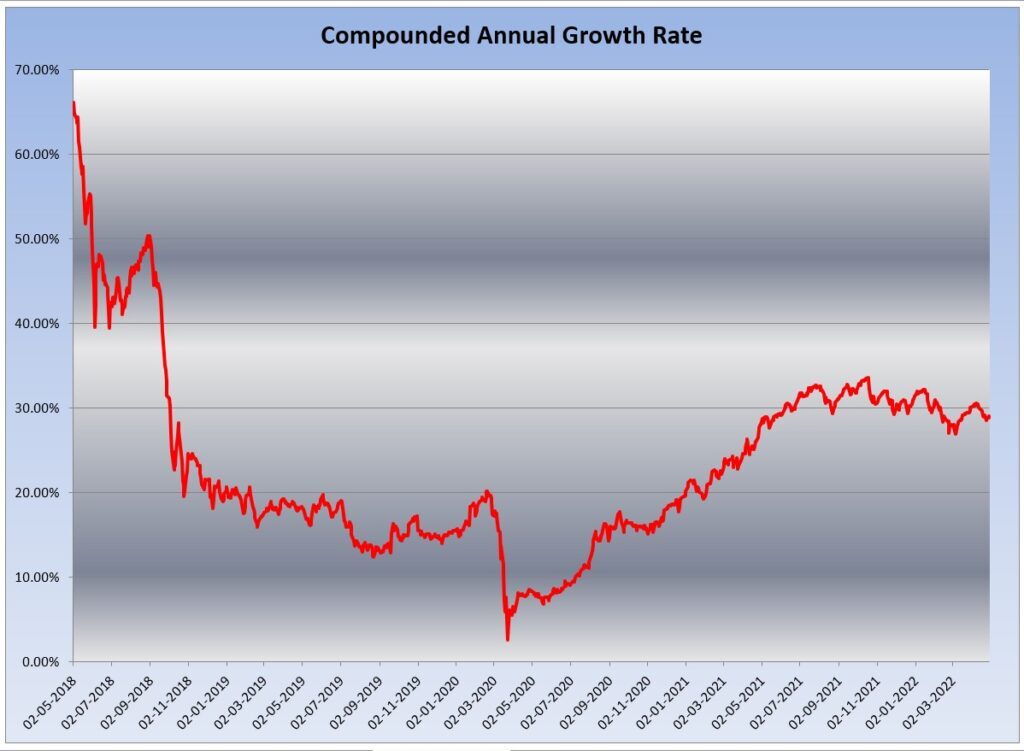
In India, Motilal Oswal made famous the 10x in Years. To achieve this, one needs to compound on an average at 24% per year. Right now, we seem to be on the right path though who knows how the next 5 years shall pan out.
Drawdown from Peak – for the Momentum Portfolio vs Nifty 500
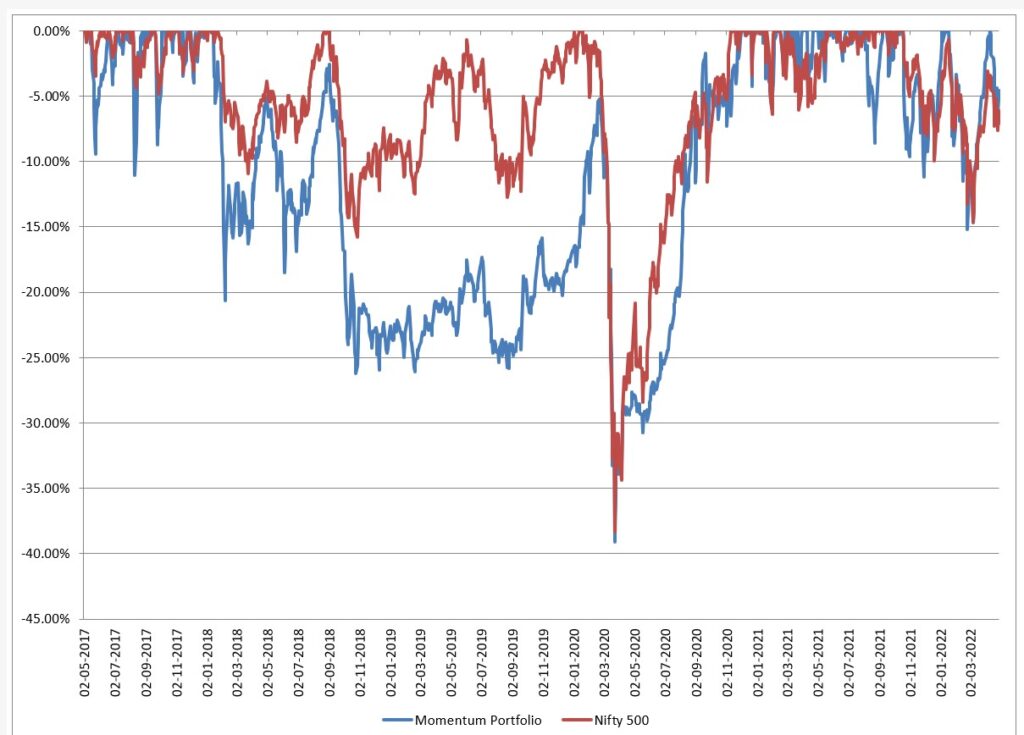
Drawdown in the years between 2018 to 2020 had been much higher than the drawdown that has been seen hence. My own expectation is that we should see a divergence once again in the future.
Equity Curve
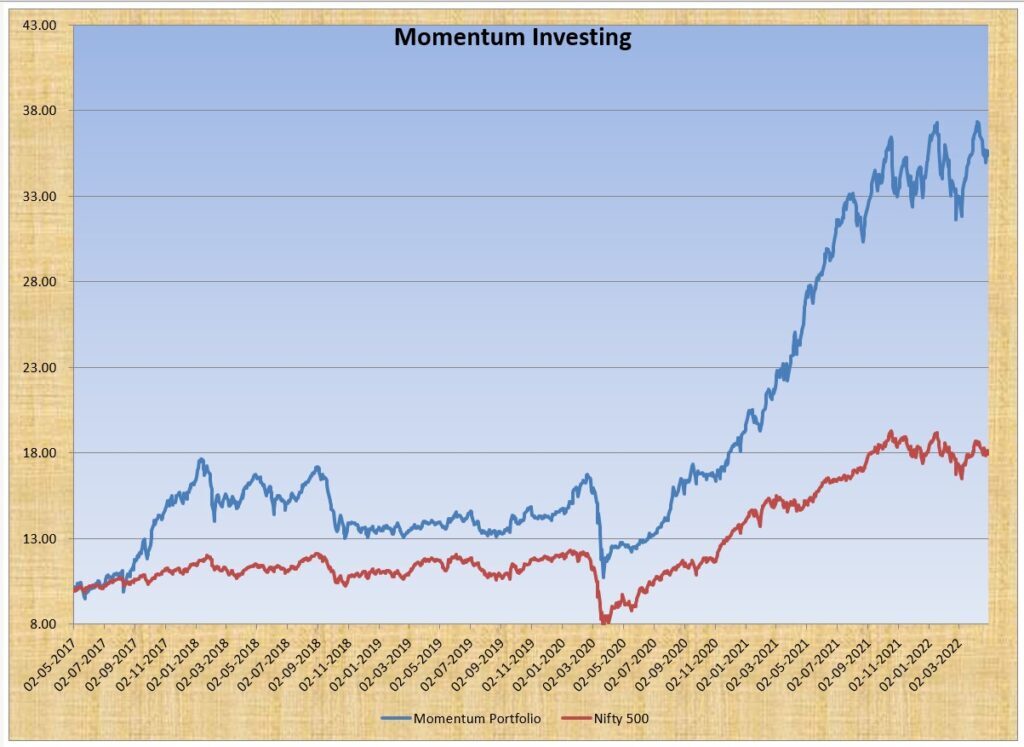
While the strategy seems to beat Nifty 500 by a fair distance, there have been funds that have in the same period delivered pretty excellent returns but there is always the question of whether (1) Could we identify them beforehand and (2) how much could we allocate to such a fund.
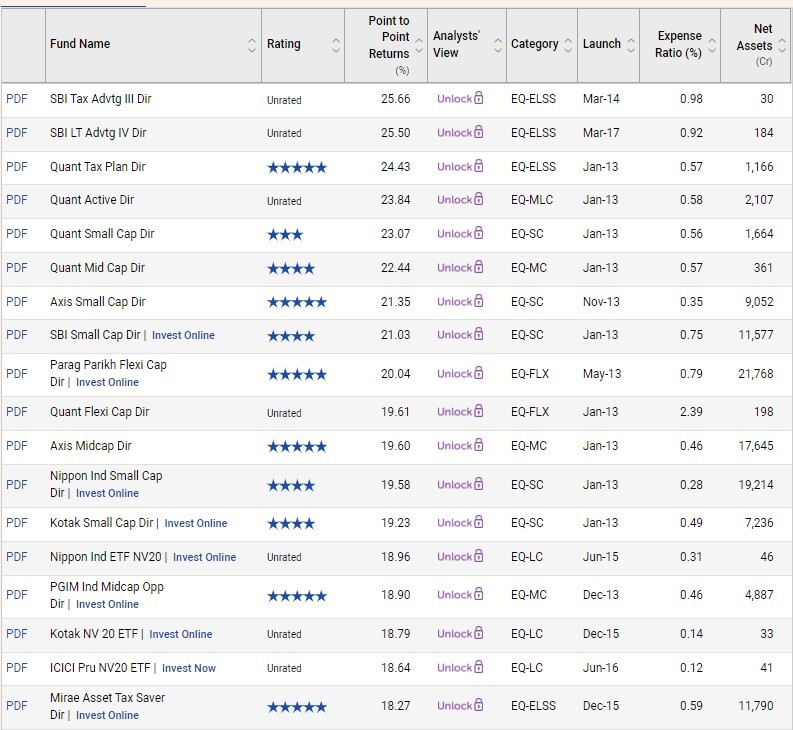
As I have written in one of the past annual letters, my objective is to be in the top quartile if not the top. For now it seems to be accomplished thanks to the huge pushup given by small cap stocks since the Covid Crash. In fact, the returns for the Momentum Fund could have been easily obtained by just buying and holding a Small Cap Index Fund post the Corona Crash.
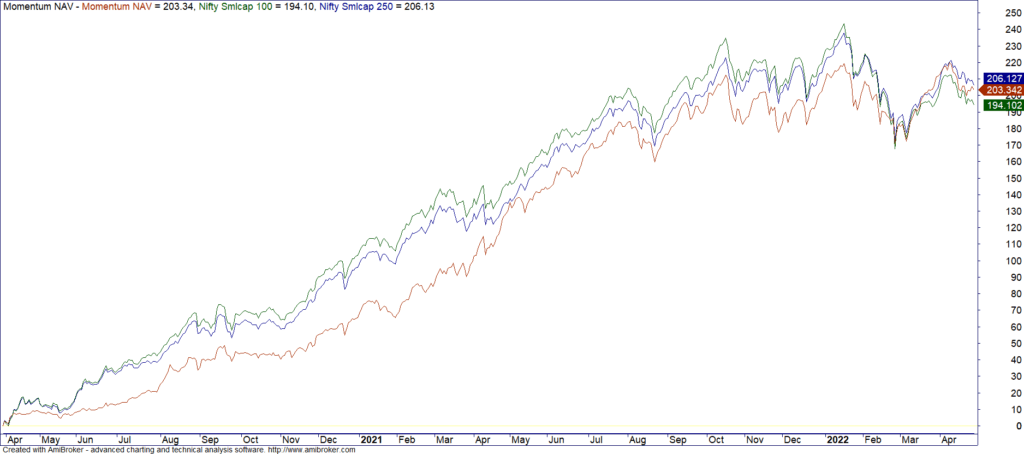
While much of the Alpha for Do it yourself Momentum I believe comes from exposure to small caps, the advantage of Momentum strategy is that when the small cap starts to break the trend, we scale down the positions as well. The chart below shows the exposure to Large Cap, Mid Cap and Small Cap at end of every quarter
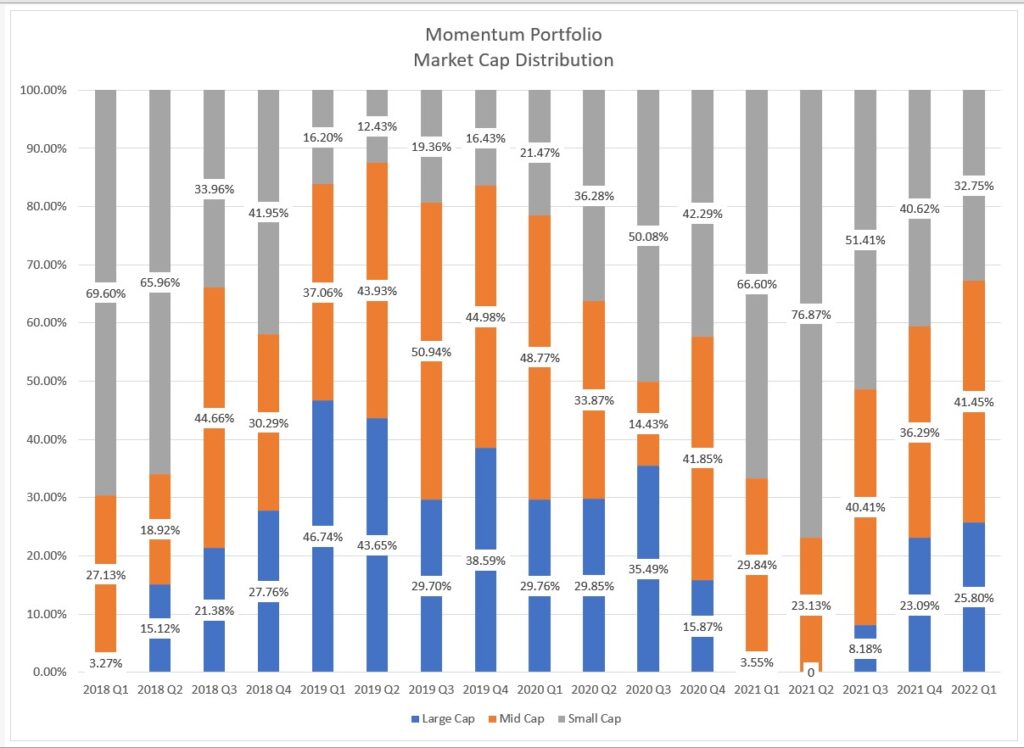
As you can notice, exposure to small caps was just 21% at the time of the Corona Crash. This shot up to 77% in the second quarter of 2021 and has been falling steadily since then.
Exposure to small caps did increase volatility by a slight margin. Since the start, Volatility for the strategy is 15% vs 12% for Nifty 50 and 11.50% for Nifty 500
Unlike fundamental portfolios, the holding period of Momentum portfolio tends to be on the lower side. The median holding period came to around 3 months.
During the 5 years, have traded around 275+ stocks of which just 120 stocks had a profitable exit. In fact, the combined profit for the strategy (booked profits) came from just 22 stocks.
The biggest worry for investors is high churn. Momentum is a high churn strategy but as the table below shows, churn is pretty consistent other than for a few exceptions

One new test that started in 2021 was with buying a portfolio of Nano Cap stocks using Momentum. One year and bit more down the lane, the results aren’t something really outstanding given the amount of risk involved. But results being decent means that its worth studying.
Overall, for the amount of efforts required, the returns are more than decent and wile it maybe years before one can be sure that we made our money not due to luck, the trend seems to be good for now. Until next year..Adios.



Is there any plan to introduce low vol portfolio too as NiftyLow Vol gives good support for momentum?
Nope. Not a believer that it adds any real value.