
Budget & its implications on Markets
Since long Budget day has been seen as one the The most important trading days in the history of the stock markets. So much so that regardless of whether its been a week day or not (Saturday as Budget day falls this year for instance), markets have remained opened during the time.
Budget day trading is a Speculator’s delight. Huge swings can be seen in stocks based on how the market perceives what the finance minister just spoke. The reactions are instantaneous when one perceives the huge benefit for the huge disadvantage that comes up due to the addition or removal of some duty.
It used to be a Carnival like atmosphere in most brokerage houses until recently as the wild movements accompanied by ecstatic trading meant that regardless of whether you made money or lost or were just a bystander who had come to witness the event.
Before 2000, Budgets used to be presented in the evening based on the legacy we carried from the time of the British (a subsidary company cannot present its accounts before the holding company na:) ), Budgets used to be presented at 5 in the evening and while markets closed once the Budget got over, the next day was open regardless of the fact as to whether it was a Weekday or a Weekend (Sundays including).
Since Sensex data goes back only so much, I have been able to Analyze the Budget day movements from 1981 onwards. The data provides for some interesting insights.
There are basically two types of Budgets. The full budget (like this time) which is generally presented on the last day of February and has the accounts for the whole upcoming year. We also have what is known as the Interim Budget in years where there is a scheduled election. Dates of those are not the same and as can be seen in the data below, is pretty varied. While the first Interim Budget is really Interim in nature, I have treated even the full budget that follows that as Interim since it comes generally in the mid of the year and hence not exactly comparable to the full budget that is presented in Feb.
So, lets first look at the data of how markets moved in the day prior to the Budget, the day of the Budget and the days following that (click on the pic to expand)


The YoY percentage number refers to the return generated by Sensex from the date of the Budget to the next and its here that I notice something interesting. The full budgets are better off for the markets (in a positive way) compared to the Interim.
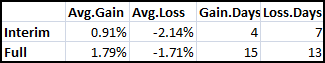
Of course, the whole variation maybe just because of sample size, but something for the bulls 🙂
But even more interesting is the impact of Budget day on the future.
Scenario 1 deals with Impact on markets if markets closed positive or negative on the day of the Budget.
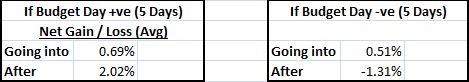
If markets end the day of the Budget in positive territory, there is a very high probability that the trend shall continue to dominate for the upcoming week as well and if they end in negative, again high probability of the trend continuing. Also included in above data is how markets had behaved going into such days. Not much of a difference can be seen which leads one to believe that budget numbers were sacrosanct and markets were genuinely surprised or disappointed.
How about for the year ahead you may ask and here is the data for the same
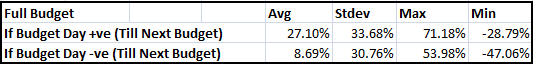
As you can see, the probability of markets continuing to move in the same direction as one based on just what it did on Budget day extends to the forthcoming year as well.
As much as we would like to believe that Budget day plays a huge role based on above evidence, there is one thing we are missing and that is how the impact is based on how expensive or cheap the markets were at that point of time. Unlike Sensex data, I have data for Sensex Price Earnings going back to only 1991 and that is the time from which this analysis prepared. Additionally since Sensex Price Earnings ratio has been stopped been given free,, I have shifted to Nifty Price Earnings Ratio from December 2012.
Readers of this blog will remember that I post Nifty Price Earnings ratio with a Mean calculated from the 1st data point to the last. I also compute the standard devation of the said data to provide us with something to compare and constrast current data with. In this case, for the early years, the average is not exactly something that is sacrosanct since it uses very little data but as the years go by, the average really starts to become closer to what we see in recent years. So, without further ado, here is the data split into two pics – one for those years where markets went up and one where the markets went down post budget till the next budget.
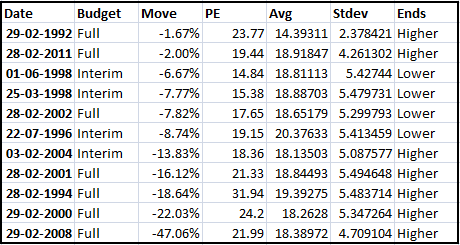

The Ends column refers to whether Price Earnings was below the Average on the day of the Budget or above it. In 11 out of the 18 instances that markets had a positive return, PE was below the average. In case of years where markets went down, only in 4 out of the 11 instances were PE below the average.
Currently Nifty Price Earnings Ratio is well above the 1st Standard Deviation on the positive side and that is not a good sign for the forthcoming year if history is any guide.
The first full budget presented by the last NDA government had the markets all happy as Sensex zoomed up 5.13%. Will this budget create a similar euporia?

Recent Comments