
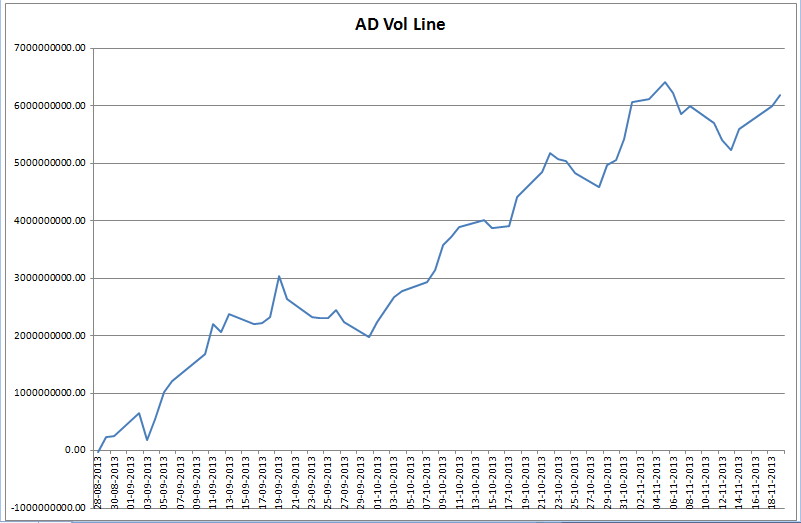
AD Volume line for CNX 500 stocks
A rally is said to have legs if the move is accompanied by strong volumes. One such indicator to measure the breadth of a market is the AD Volume Line. You can read more about the indicator here: http://stockcharts.com/help/doku.php?id=chart_school:technical_indicators:ad_volume_line
Below is a chart of the same calculated on stocks forming part of CNX 500 from the day market made a major bottom 28/08/2013 till date (19/11/2013).

Recent Comments