
Trading with the Longer Trend
One of the often quoted things is that one should always trade with the higher trend. So, if the higher trend is bullish, it makes sense to avoid shorts and take only longs and vice versa. As much as the advise seems great theoretically, its only after testing can we really be sure whether such a strategy really makes economic sense.
The biggest draw-back so as to say when it comes to trend following is the streak of losses that one sees. This generally takes place when the markets are undecided on where next to go and oscillates between a high and low point.
With the current trend among traders being “Market Profile”, this area is also seen as bracket area where both the bulls and bears are in control of their respective zones and defend the same. So, when markets go to the upper range, bears become pro-active as they short the market with the anticipation of a pull back to the lower zone where bulls are willing to take charge.
For a trend follower though, such back and fro movements are killers as they get repeatedly stopped out while the market in itself would have not moved anywhere. Or even worse, we get caught in counter trend trades, even as the larger trend in itself is relatively undisturbed.
For example, take a look at the chart below. Its of CNX Nifty (Spot) with Arrows being the Buy & Sell signals generated based on a simple 3 * 5 Moving Average Crossover

Specifically concentrate on the marked area – the markets were well and truly bearish, yet, our buy signals got triggered a lot of times before the final Buy actually resulted in a good profitable move
What would happen you may wonder if I were to add another longer term Moving Average to figure out whether the trend is Up or Down and act based only upon that.
Since we are looking at the whole situation objectively, we will need to not just randomly pick up a Moving Average which shall tell us whether the trend is up or down but find that number by analyzing all possible options.
One way to do that would be simply optimize the parameter at hand. Of course, we shall then fall into fitting the curve, but since the idea is to see whether our logic is right or not, we will not worry about it for the moment.
So, on top of the 3 by 5 Moving average crossover, I tested for what variable would be the best fit (one for the Bullish trade and one for the bearish). After testing through nearly 35,000 options, the best among the lot seemed to suggest using 150 day MA for our bullish objectives and 200 day MA for our bearish objectives.
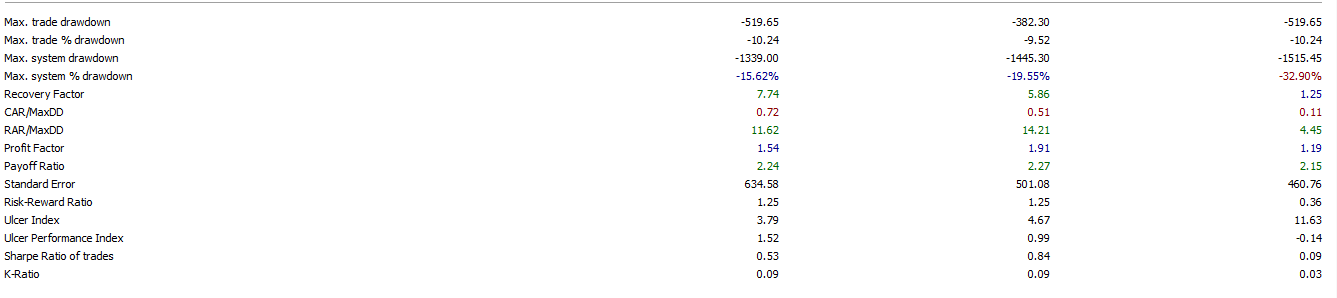
Before we go ahead and see the results based on this, lets first see the results of the standalone system.
The test was carried out on EOD CNX Nifty (Spot), No commissions were included and all trades were taken on the closing price of the same day. No compounding of Positions was allowed.


As you can see, while the long trades are extremely profitable, even shorts end up in profit territory despite the fact that markets as a whole has moved up by around 6500 points in the interim.
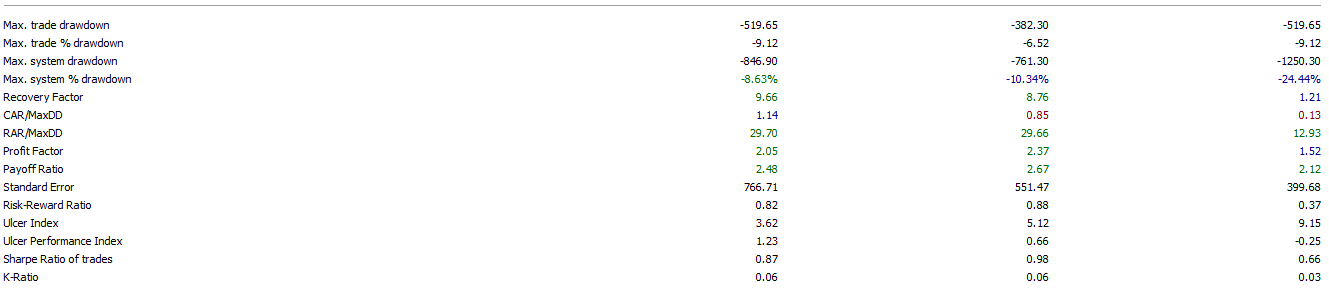
Now, lets apply our filter of going long only if Signal has come with Close > Moving Average of 150 periods and going short only if Close is < Moving Average of 200 days.
Because of the additional filter, this system will not be a Reversal system anymore (i.e., Long exit is also Short entry & Short exit is also the trigger for Long)
Results are as follows;


So, what are the key differences between them.
First is the fact that having a filter reduces Net Profits. While a simple Crossover provides us with 10,363 Nifty Points, the Filter reduces this to 8,181, a reduction of 21%.
The Number of trades is lower for the Filter compared to the plain vanilla approach. While the plain vanilla approach has 504 trades, the filter reduces this to 232, an incredible reduction if one were to say. This reduction also means that we are not always exposed to the markets as in case of plain vanilla.
While the plain vanilla crossover approach requires us to be in the trade all the time, in this case, that requirement is no more present. The filter version is in the market for 2117 days vs the normal which is in the market for 4333 – again a huge difference.
And finally, lets look at the most important factor – draw-down. System draw-down for the plain vanilla was 15.62% vs 8.63%.
All in all, having a filter will help in having a smoother returns but has the opportunity cost of missing trades (ones where the market trend is changing from Bull to Bear and vice versa).
Its all finally about give and take. If you are happy with a lower return (point wise), you can smoothen your equity curve. But if you are happy & are able to take in volatility, plain villa offers you a higher profit ratio.
Max. system drawdown 8.63 % is less than max max. trade drawdown 9.12%.
Am I missing something.
Max Trade Drawdown is calculated from the High to the Low while Max System Drawdown is calculated from Close to Close.